
A colleague / friend of mine is a graphical (web)designer. A few months ago she got a big project to redesign the website (from graphical point of view) for a famous brand. Before she started to work on her wireframes and designs, she asked me if Google Analytics can help her with some design decisions, event though her client was not really interested in diving into any analytics data at that point.
So, we met and went through the existing website design and Google analytics usage data and my designer-friend was amazed by the experience, insights and the things she could learn and take away for use in her new design. Even her client couldn’t say ‘No’ after she gave a few examples of Google Analytics data, on which she based her new design.
Thumbs up to my friend!
I really hope that companies and brands start to use more data / web-analytics-driven approach before they start rebuilding their website and applications.
Now, you surely want me to get to the point, namely:
- to learn more about features we looked at;
- to know more about which data of Google Analytics can provide you with some relevant insights before you start rebuilding your website;
- furthermore how the Analytics data can help you identify where you can improve visitor/user experience and so on.
For us all started within Behaviour section in a key-learning feature:
One of the greatest Google Analytics features is a visual assessment In-Page Analytics, which allows you to see how customers interact with your web pages and helps you to find answers tothe following questions:
- Where my website visitors do click the most? Where they don’t click at all or less?
- How good my website layout is?
- Do my visitors find what they are looking for?
- Which content is most interesting for them?
- How good are my call to actions? How visible are my important content elements?
- Which menus work the best?
- Which links are being clicked on?
- etc
How does it work?
Control bar

At the control bar you can choose the metric you want to see in the report: e.g. clicks with more than 5% etc and set a threshold for visualizations of that metric in your report by choosing between features as ‘show bubbles’(these indicate the links users clicked.), ‘show colors’ (this feature applies different colors to bubbles of different values. ) or ‘browser size’ (this feature lets you see the portion of your page that is visible without scrolling to the percentage of traffic you identify.).
There is also a Page layout feature available.
Page layout
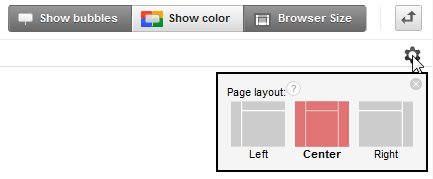
Page layout is a feature of Browser Size that lets you select the general alignment for the primary content on your page (Left, Center, or Right) so the Browser Size feature is aligned with that primary content.
To know how to use Google In-Page Analytics visit: https://support.google.com/analytics/answer/2558864?hl=en&ref_topic=2558810
There is Page-Analytics Chrome extension available here for download:
https://chrome.google.com/webstore/detail/page-analytics-by-google/fnbdnhhicmebfgdgglcdacdapkcihcoh?hl=en
Then we moved to Audience section the second very important feature as:
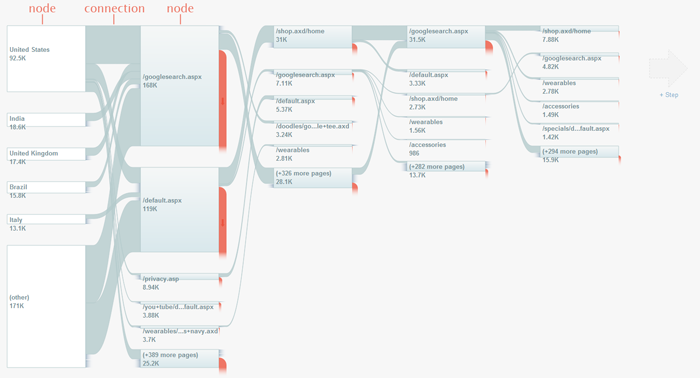
Visitors Flow is a graphical representation of the paths users took through your site, from the source, through the various pages, and where along their paths they exited your site.
This flow helps you to see which way visitors make on your site. Where they start and where they say you ‘bye’ or ‘good-bye’. When you are selling a product, or have a ‘donation’ page, contact form, subscription form, or in the case of the client of my friend it was the series of products it helps you to see how many steps visitors/users make through the website to find what they are looking for. In the case of my friend client we could see that some navigation paths to the products pages could be much much easier and shorter.
Furthermore in Visitors Flow you can see which landing pages for different online and offline campaigns are so good that visitors continue to stay on your website and browse further. Which pages can be the best pages to trigger the potential commercial interest.
Other important features:
The Site Search reports provide information about:
- how many of your traffic uses the search engine on your site.
- the search terms your traffic uses.
- how your traffic engaged with your site as a result of their searches (e.g. whether they refined their searches, viewed more pages, or exited).
Google Analytics Content Experiments
With Content Experiments Google Analytics found different approach to a standard A/B testing and multivariate testing. Content Experiments uses an A/B/N model, where you are testing up to 10 full versions of a single page, each delivered to users from a separate URL.
Average session duration is: total duration of all sessions (in seconds) / number of sessions.
Bounce Rate is the percentage of single-page sessions (i.e. sessions in which the person left your site from the entrance page without interacting with the page).
The Site Speed reports measure three aspects of latency:
- Page-load time for a sample of pageviews on your site.
- Execution speed or load time of any discrete hit, event, or user interaction that you want to track (e.g., how quickly images load, response time to button clicks).
- How quickly the browser parses the document and makes it available for user interaction.
Finally, always learn from your top performing pages!